Bridge Tool Logging
NDI 6.1 provides a new version of NDI Bridge that allows for additional settings and a new logging feature that allows you to get even greater insight into the capabilities of your NDI Network.
Buffer Test
Since NDI 5, it’s been possible to set a buffer when connecting to or hosting a Bridge network that will store up frames of data up to a certain amount before sending them to the rest of the NDI Network. While this does increase latency, it also allows a seamless viewing experience where the viewer shouldn’t notice a drop of signal or frames that can naturally occur when video is transmitted over the public Internet. Previous version of NDI Bridge would allow the user to define their own size of that buffer as a trial an error, but with NDI 6.1’s new Bridge, there is a “Test Buffer" application that can recommend buffer size.

To use it, follow the steps below:
Launch NDI Bridge 6.1
Connect to your Bridge host if your the Join, or have a remote connection connect into your Bridge application if you’re the Host
Once connected, click on Start Test. Packets will be sent and received, and the recommended buffer will be shown.
Run the test for as long as necessary, then click Apply to use their recommended buffer size.
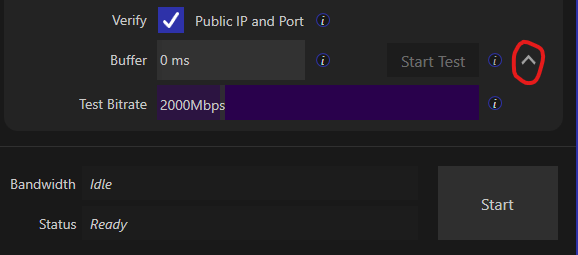
To run the test, both the Bridge Host and Bridge Client/Joiner must be running NDI 6.1.
System Stats
One of the most powerful aspects of NDI is it’s ability to be flexible in it’s installation requirements, it doesn’t need a purpose-built machine. NDI Bridge, like all other NDI applications, is as powerful as the system it’s installed on, but until now there hasn’t been an easy way to determine how much system resources it uses. With NDI 6.1 Bridge, a user can now get a number of helpful stats that may pinpoint potential bottlenecks in a workflow. To access the system stats to see a live view of NDI Bridge’s resources, click the gear labeled Settings and Diagnostics and choose Statistics.
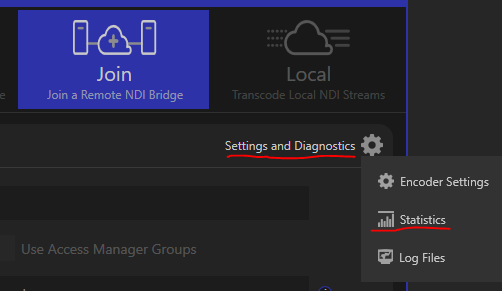
Clicking this will open a new window that can be positioned and resized anywhere, with helpful graphs and stats for the current connection. Each graph can be expanded to show a greater detailed view of the current resources.
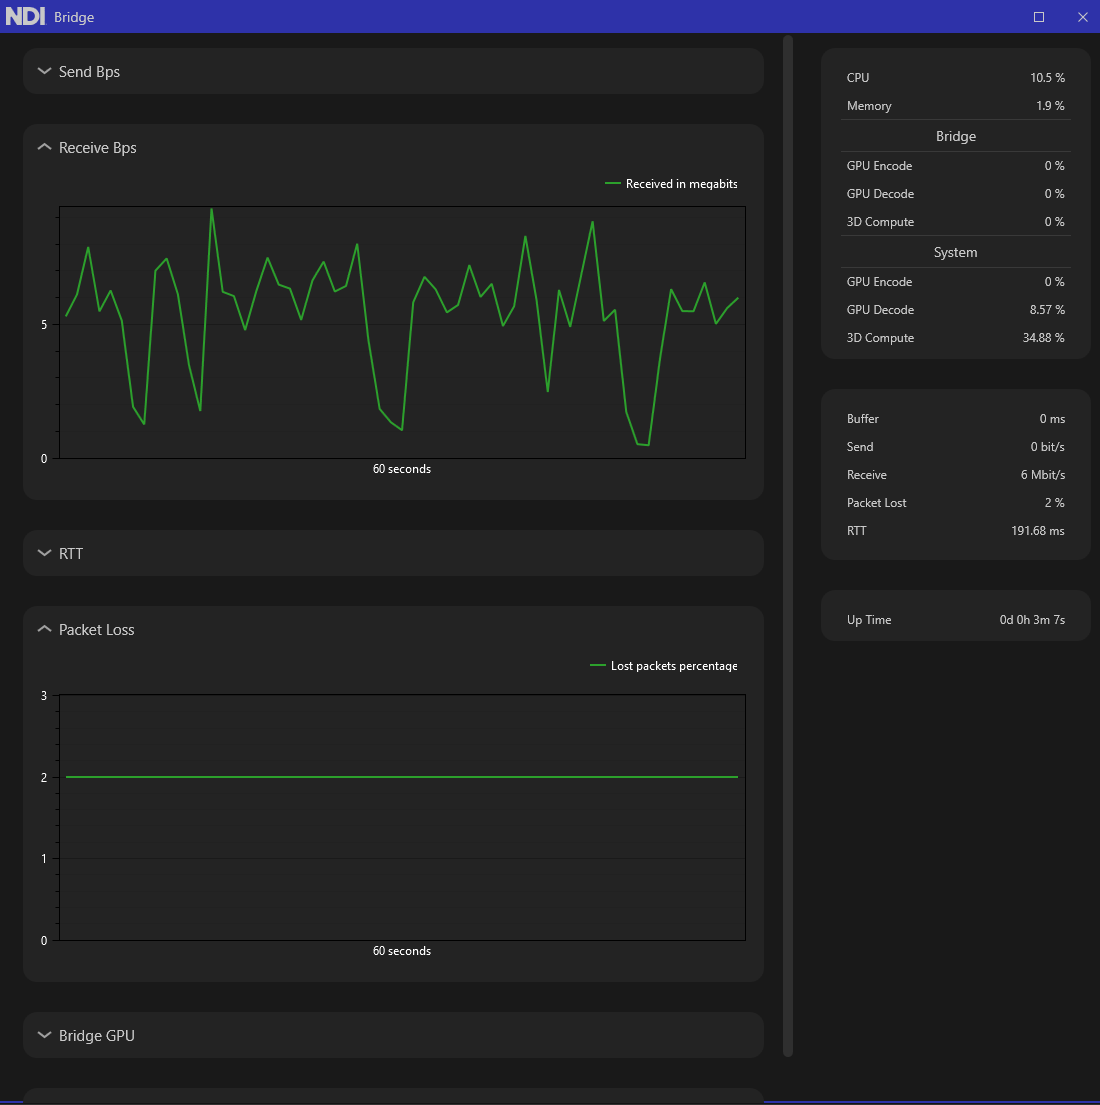
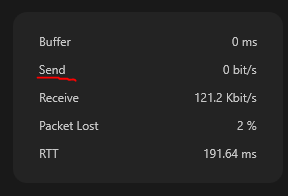
Send Bps: Usually measured in mbps but depending on how much traffic is sent it can be kbps, this is the amount of data that’s being sent from the current machine to the destination. The graph measures only the last 60 seconds of data in a rolling, live view.
To see the current metric, the right hand-side column also displays the current bitrate of the sending device.
Receive Bps: This graphic shows a 60 second view of the amount of traffic being received by the system it’s installed on. Usually measured in mbps, it will give the user an idea of how much bandwidth that Studio Monitor or another NDI receive is receiving from the Bridge network.
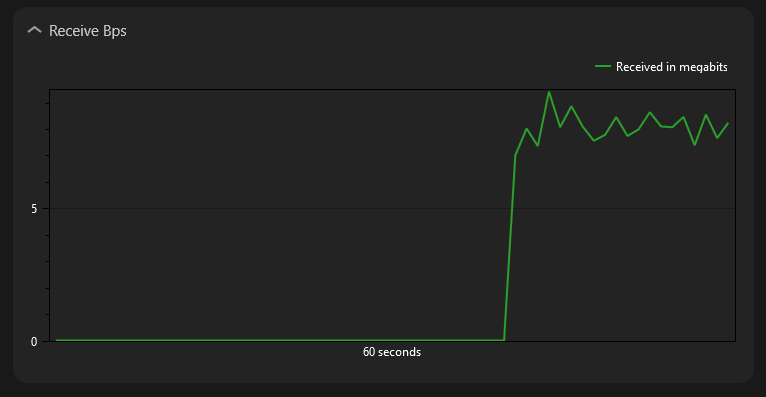
This is also shown on the right hand side metric under Receive, where it shows a live view of the incoming bitrate.
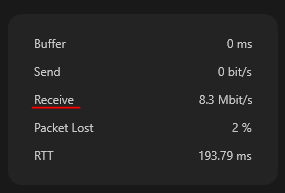
If the Send and Receive numbers vary too greatly, there’s probably packet loss or connection issues which can result in poor performance. Increasing the Buffer size or using the recommended buffer settings may alleviate these issues
RTT: Round Trip Time is the measure of how long it takes a packet to be sent from the host to the receiver and back again. The graph shows a live view of the past 60 seconds and the right hand column shows a live view of the current RTT.
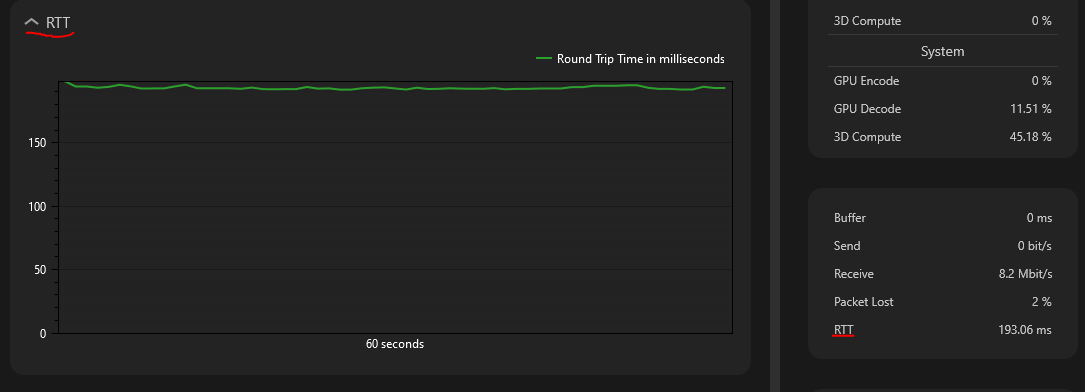
The RTT value may be high, but the key aspect to look for is consistency- a RTT value that fluctuates often indicates a poor connection and poor video performance
Packet Loss: Much like RTT, the key aspect here is consistency. Have a video stream with 0 packet loss would be ideal but in a world where video is transmitted over the public internet it can happen.

0 packet loss is preferred, but if the number grows over time or fluctuates, there’s an issue with the incoming stream or receiving PC dropping packets. Increase buffer size may be one way to alleviate that.
Bridge GPU: NDI Bridge provides 3 metrics for the GPU that the connected Bridge system (either host or join) is running on, GPU Encode, GPU Decode, and 3D Compute. This measures the amount of GPU usage that the Bridge service is using by itself to send an encoded signal.
These are a measure of the Bridge’s utilization only, not of the entire utilization of the engines of the PC. If packet loss occurs or the RTT is high and the buffer can’t resolve it, the Bridge system’s GPU may be at maximum and unable to render frames as quickly as necessary, resulting in poor video performance. Unfortunately, there’s not a way to resolve this outside of upgrading the PC or lowering the demand of other applications on that PC.
System GPU: Like the Bridge GPU, the System GPU must also decode frames of video for viewing and playback. If the System GPU is at maximum for resources but the connection is fine, the viewer will still notice dropped frames and other apparent issues they may cause them to incorrectly assume the network or NDI Bridge is at fault.
On the right hand side, there are a number of stats also available at any given time.
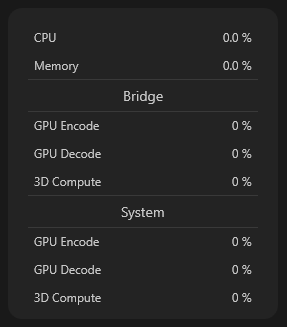
CPU and Memory refer to the percentage of CPU that is used by the system at the time. Memory refers to amount of RAM that the Bridge application is taking up by itself. As Bridge is software, we recommend you make sure those numbers stay under 50% utilization, the lower the better. This may mean closing out other open applications and shutting down other services that are taking processing cycles and using the RAM. If the Memory measurement creeps up, it could indicate a memory leak or a process that is stuck running and not shut down properly.
Under System are the same three metrics, GPU Encode, GPU Decode, and 3D Compute, which measure available metrics as reported by the system. GPU Encode is if the system is encoding from High Bandwidth to HX, and GPU Decode is used for receiving a signal and displaying it on Studio Monitor. 3D Compute is the overall usage of the GPU of that system. It’s important to note that 3D Compute is variable depending on the system. Sometimes it’s the 3D Compute engine is used to encode/decode, and sometimes it’s used for color conversion. If the system Bridge is running on has two different GPUs, the tasks will be spread out to reduce load. As a general rule keeping those values low will show improved performance.
Last updated
Was this helpful?

